
The numbers don’t lie, even when politicians wish they would.
Climate change has become the ultimate political football, tossed around by talking heads who treat scientific data like optional suggestions. But here’s the problem with treating temperature records like opinion polls: thermometers don’t have party affiliations, and ice sheets don’t vote. While debates rage about policy solutions and economic impacts, the physical world keeps delivering facts that make headlines regardless of who’s in power.
Scientists measure what actually happens, not what we hope might happen. When researchers publish peer-reviewed studies about rising sea levels or melting glaciers, they’re not crafting campaign slogans—they’re documenting reality with instruments that couldn’t care less about election cycles.
1. Earth just experienced its hottest year since temperature records began in 1850.

Temperature measurements don’t follow political talking points. 2024 shattered heat records globally, reaching 1.6°C above pre-industrial levels and surpassing the previous record set in 2023 by a significant margin. According to NASA’s Goddard Institute for Space Studies, the ten warmest years in the 175-year record have all occurred during the last decade. This isn’t cyclical variation—it’s a clear trajectory that scientists predicted decades ago based on greenhouse gas physics.
What makes this particularly striking is the consistency across measurement systems. Satellite data, ground-based thermometers, and ocean buoys all tell the same story. No amount of cherry-picked local weather events can change the fact that global average temperatures are climbing faster than natural variations can explain.
2. Atmospheric CO2 levels reached 430 parts per million in 2025.
Carbon dioxide concentrations hit levels not seen in human history. Monthly readings from Mauna Loa Observatory show CO2 climbing past 430 ppm in early 2025, representing a 54% increase above pre-industrial levels of 280 ppm. The growth rate itself is accelerating—currently adding about 2.7 ppm annually compared to less than 1 ppm per year in the 1960s, as reported by NOAA’s Global Monitoring Laboratory.
These aren’t estimates or projections; they’re direct measurements of air samples taken daily. The last time atmospheric CO2 reached current levels was roughly 3 million years ago, when global temperatures were 7°F warmer and sea levels were 82 feet higher than today.
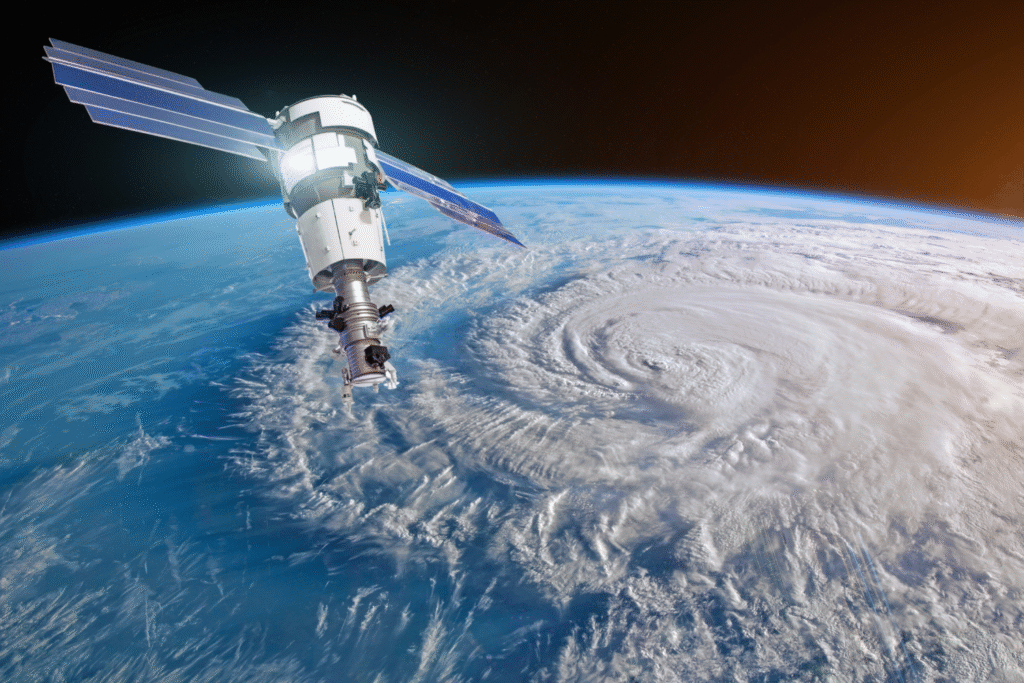
3. Arctic sea ice hit its lowest winter maximum ever recorded in March 2025.
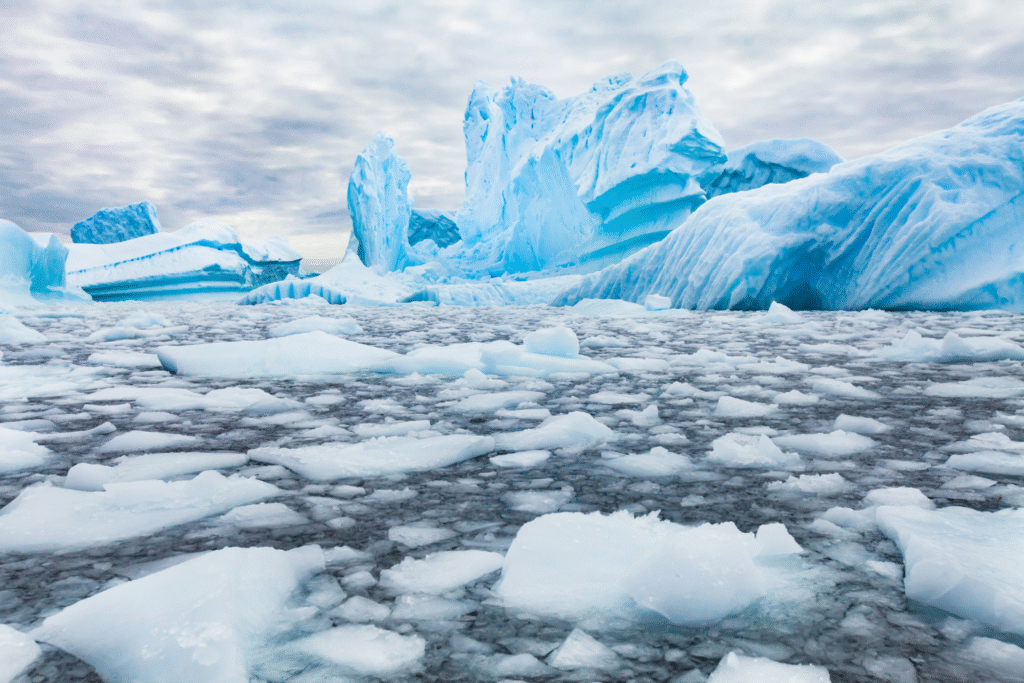
Polar ice doesn’t negotiate with political narratives. Arctic sea ice reached its annual peak at just 5.53 million square miles on March 22, 2025—the smallest winter maximum in 47 years of satellite observations. According to the National Snow and Ice Data Center, this represents 1.1 million fewer square miles than the previous year and breaks the prior record set in 2017.
The implications extend far beyond polar bears. Sea ice acts as Earth’s refrigerator, reflecting sunlight back to space. As ice disappears, dark ocean water absorbs more heat, creating a feedback loop that accelerates warming. The loss of ice equivalent to twice the size of Alaska since 1979 demonstrates how quickly planetary systems can shift.
4. Ocean temperatures are breaking records while absorbing massive amounts of heat.

Marine thermometers reveal uncomfortable truths about where all the extra energy goes. The world’s oceans have absorbed over 90% of the excess heat trapped by greenhouse gases, with the top 100 meters warming by 0.67°F since 1969. Ocean heat content measurements show continuous increases year after year, providing the thermal energy that powers stronger hurricanes and disrupts weather patterns globally.
Even more concerning, ocean temperatures in 2024 broke records in all major basins simultaneously. This isn’t regional variation—it’s systematic heating of the planet’s largest heat reservoir, with consequences that ripple through marine ecosystems and coastal communities worldwide.
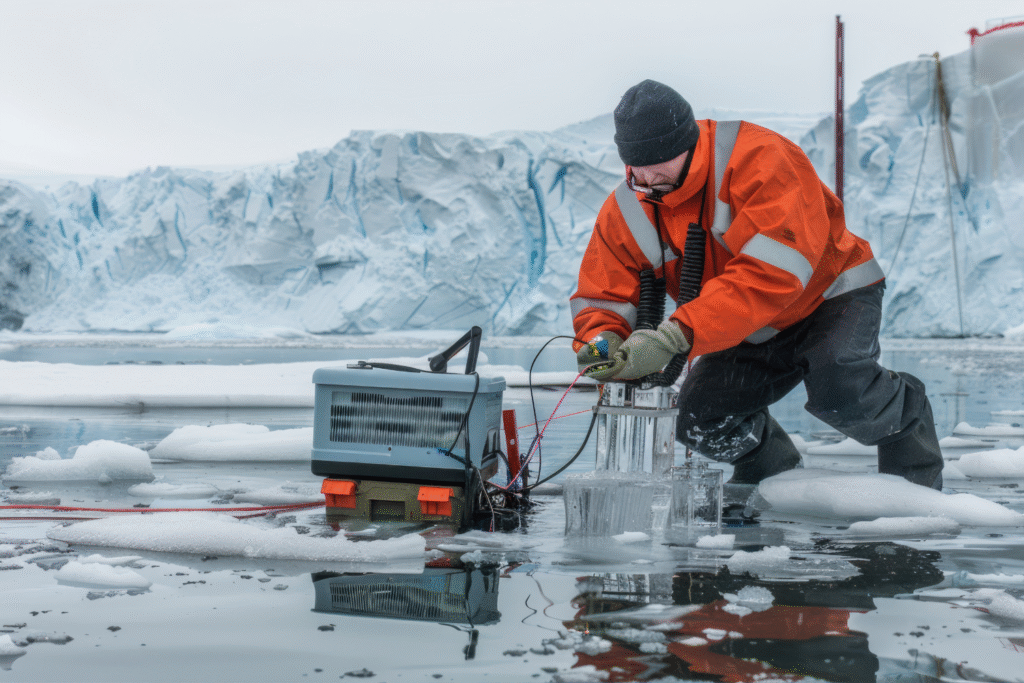
5. Greenland lost an average of 279 billion tons of ice per year between 1993 and 2019.
Gravity measurements from space don’t have political opinions. NASA’s GRACE satellites precisely track mass changes by measuring variations in Earth’s gravitational field. The data shows Greenland shedding ice at an accelerating rate, contributing significantly to rising sea levels. Antarctica adds another 148 billion tons of ice loss annually, combining for a staggering amount of freshwater entering the oceans.
These measurements represent actual ice disappearing into the sea, not seasonal melting that refreezes. The lost ice equals roughly 1,400 cubic miles of water added to global oceans each year—enough to notice at tide gauges worldwide and flood coastal areas that were dry for centuries.
6. Global sea levels rose 8 inches since 1880 and are accelerating upward.
Tide gauges around the world tell a consistent story of rising waters. Current sea level rise rates have tripled since 1993, now climbing at 3.4 millimeters annually compared to historical rates of 1-2 millimeters per year. Coastal cities from Miami to Manila document flooding during high tides that never occurred before, even without storms.
Thermal expansion of warming seawater contributes about half of current sea level rise, while melting ice sheets and glaciers provide the remainder. The combination creates a relentless upward trend that forces coastal communities to rebuild infrastructure higher or abandon low-lying areas entirely.
7. Weather monitoring stations show heat waves becoming more frequent and intense.

Temperature sensors across the globe record heat extremes that would have been statistically impossible under previous climate conditions. Heat domes, atmospheric rivers, and record-breaking temperature spikes now occur with predictable regularity during summer months. Weather stations in typically temperate regions regularly log temperatures exceeding 100°F, while desert areas approach the limits of human survival.
The shift affects everything from power grid stability to agricultural yields. Air conditioning demand spikes beyond utility capacity, while crops wilt in fields despite irrigation. These aren’t isolated incidents—they represent the new baseline for summer weather patterns across large portions of the planet.
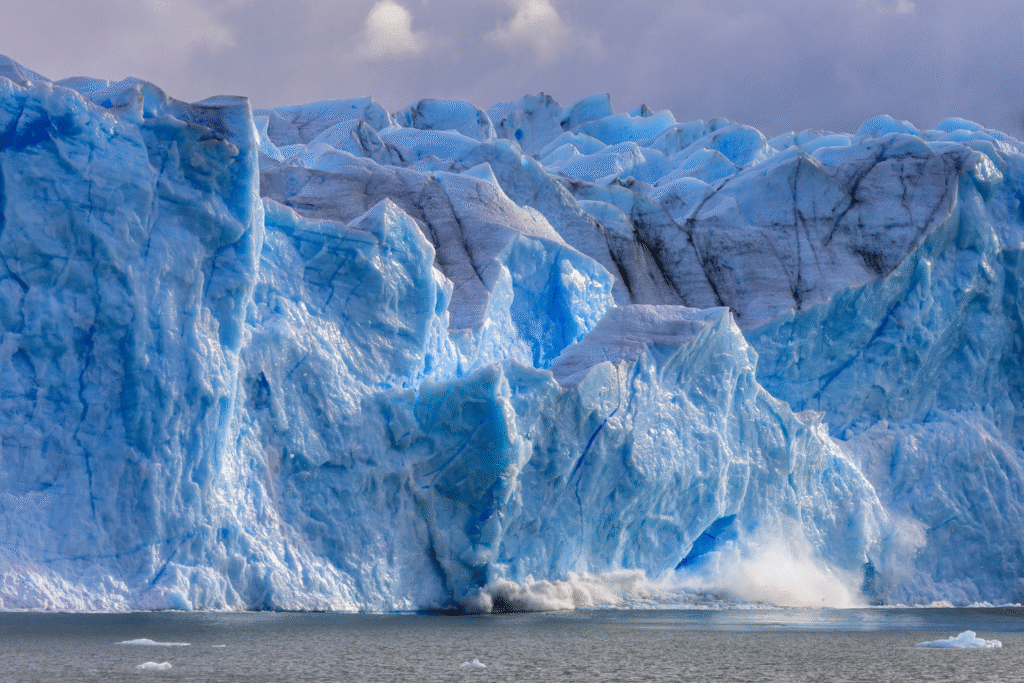
8. Glaciers worldwide are retreating at unprecedented rates in recorded history.
Photographic evidence documents glacial retreat that can be seen from space. Mountain glaciers in the Alps, Himalayas, Andes, and Alaska are withdrawing upslope and losing mass at accelerating rates. Before-and-after images spanning decades show dramatic changes in landscape as ice that formed over millennia disappears within human lifetimes.
Glacial melt affects water supplies for billions of people who depend on seasonal snowmelt for agriculture and drinking water. Rivers fed by glacial runoff experience flooding followed by drought as ice reserves disappear, disrupting water management systems that assumed consistent seasonal patterns.
9. Atmospheric water vapor increases as predicted by basic physics.
Warmer air holds more moisture—a relationship governed by fundamental thermodynamics rather than political ideology. For every degree of warming, atmospheric water vapor increases by about 7%, intensifying both droughts and flood events. Weather systems carry more moisture, leading to heavier precipitation when storms do occur, while dry areas experience more severe water stress.
This amplifies extreme weather in both directions: more intense hurricanes with higher rainfall totals, and deeper droughts as increased evaporation removes soil moisture faster. The pattern matches what climate scientists predicted decades ago based on straightforward physics principles.
10. Seasonal timing shifts disrupt ecosystems as spring arrives earlier each year.

Biological monitoring shows plants and animals responding to longer growing seasons and earlier snowmelt. Spring events like first leaf emergence, bird migration, and insect emergence now occur 2-3 weeks earlier than in previous decades across many regions. These phenological changes create mismatches between predators and prey, pollinators and flowers, disrupting ecosystem relationships that evolved over millennia.
Agricultural regions face new challenges as crops mature faster but face heat stress during critical development periods. Wine grape harvests now occur in August instead of September, while fruit tree blooming patterns no longer match pollinator activity, reducing crop yields despite longer growing seasons.
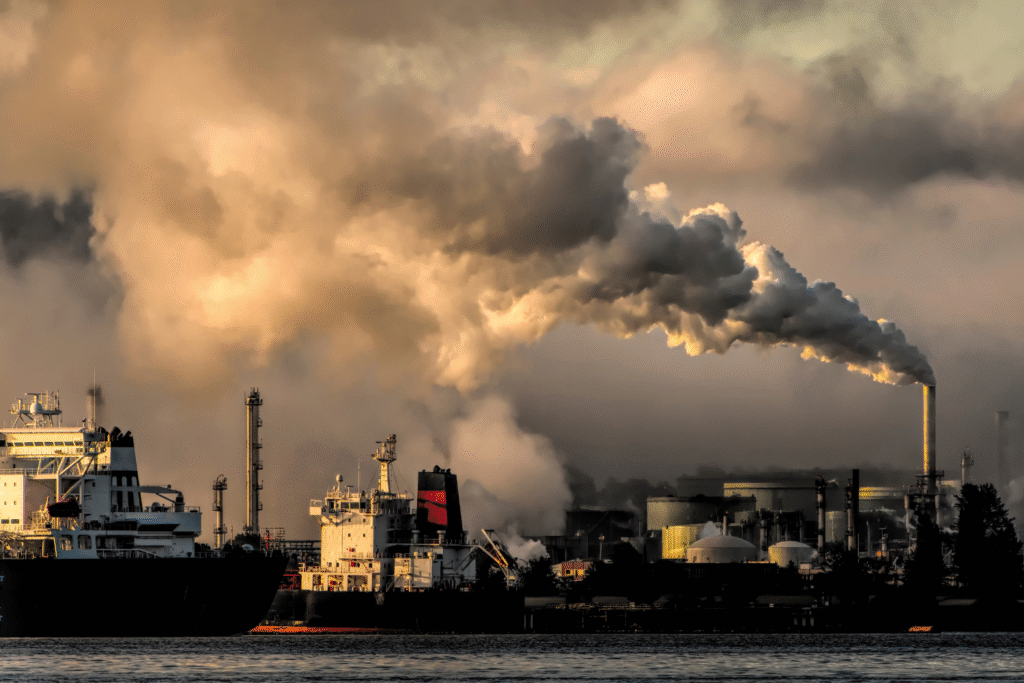
11. Scientists can literally smell the fossil fuels in our atmosphere.

Chemical fingerprints in atmospheric samples provide definitive evidence of CO2 sources. Fossil fuels contain less of the carbon-14 isotope than atmospheric CO2 from natural sources, creating a detectable signature as oil, coal, and gas combustion adds carbon to the atmosphere. Mass spectrometer analysis shows the isotopic composition of atmospheric CO2 shifting precisely as expected from fossil fuel burning.
This eliminates alternative explanations for rising CO2 levels, such as natural volcanic emissions or changes in ocean chemistry. The isotopic evidence creates an unambiguous link between human industrial activity and atmospheric greenhouse gas concentrations, providing scientific certainty about the primary cause of current climate change.