
The weak spots keep appearing in the same regions.
For decades, infrastructure failures were treated as isolated mishaps. A bridge collapse felt local. A power outage felt temporary. New nationwide datasets now tell a different story. When engineers, insurers, and federal agencies map breakdowns together, the same locations keep resurfacing. Failures track age, climate stress, funding patterns, and political neglect with unsettling consistency. Roads, pipes, grids, and flood controls are not failing at random. They are deteriorating where warning signs have existed for years, often in places residents have been quietly reporting problems all along.
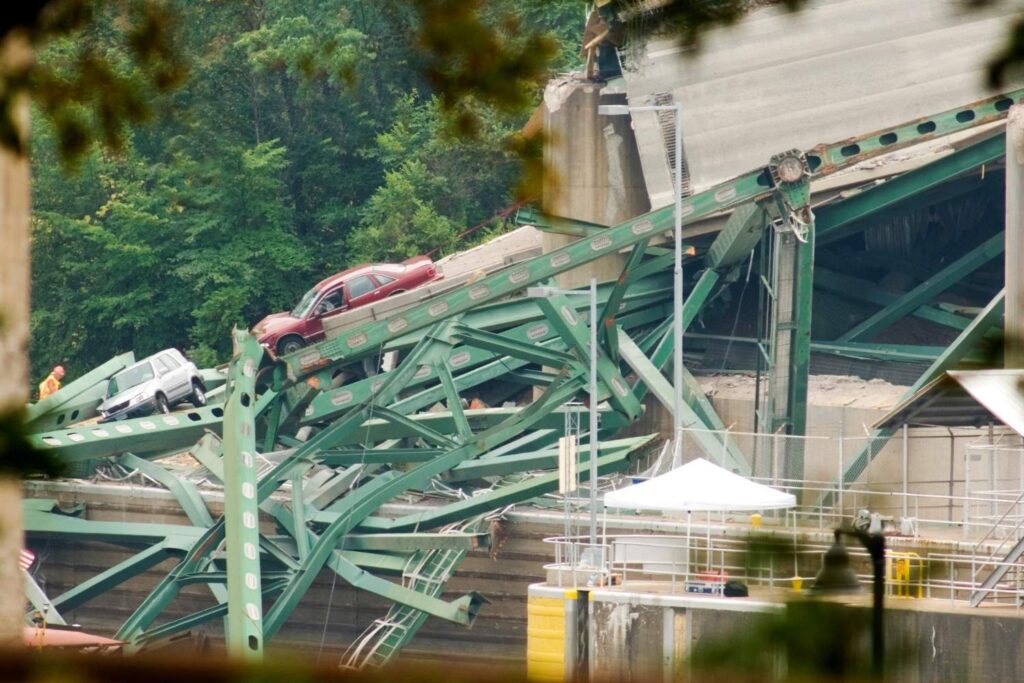
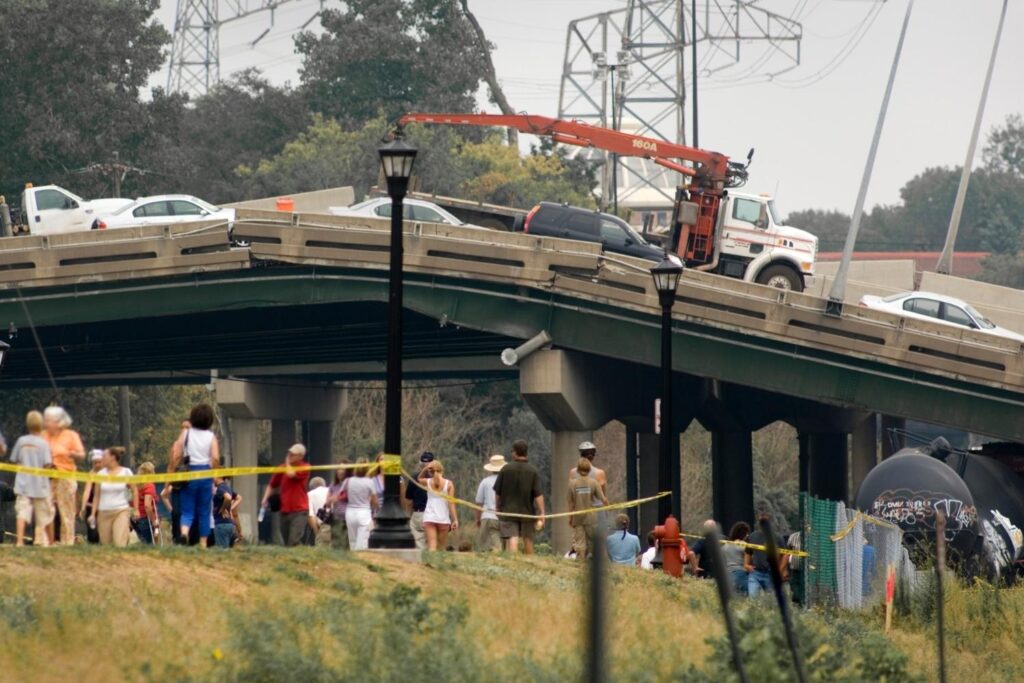
1. Older industrial cities show the fastest infrastructure decline.
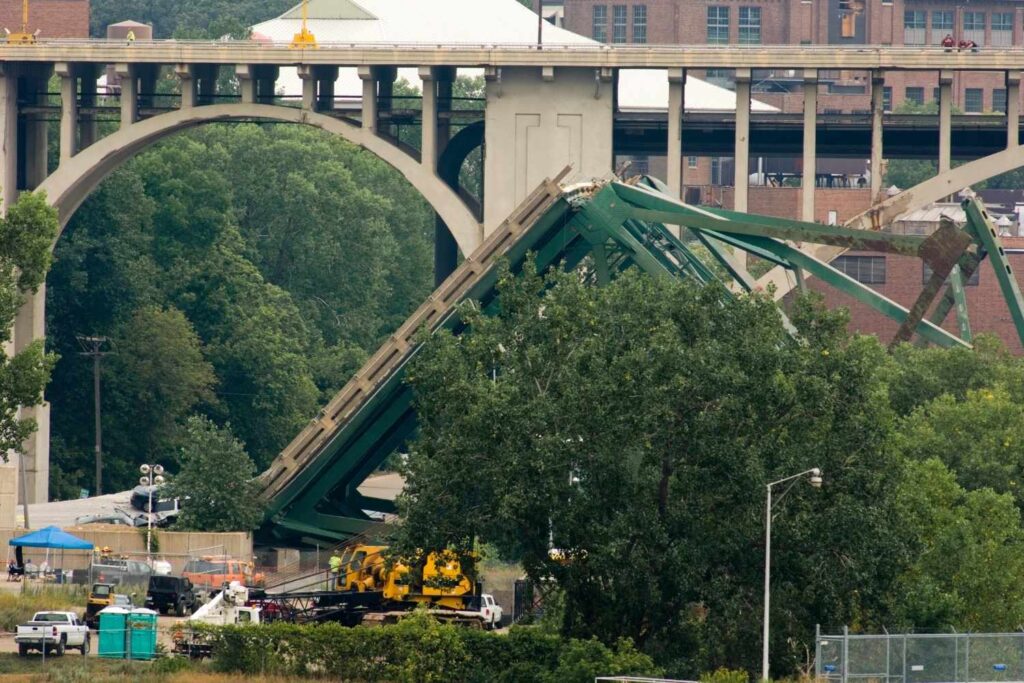
Many industrial era cities built their core infrastructure between the early 1900s and mid century. Water mains, bridges, and transit systems were designed for smaller populations, lighter loads, and different climate conditions. Those systems now operate far beyond their intended lifespan.
Engineering assessments show that failure rates spike in cities where population loss reduced tax revenue but infrastructure footprints remained fixed, according to the American Society of Civil Engineers. Deferred maintenance compounds annually. Each delayed repair increases stress on adjacent systems. What looks like sudden collapse is often the final stage of predictable deterioration decades in the making.
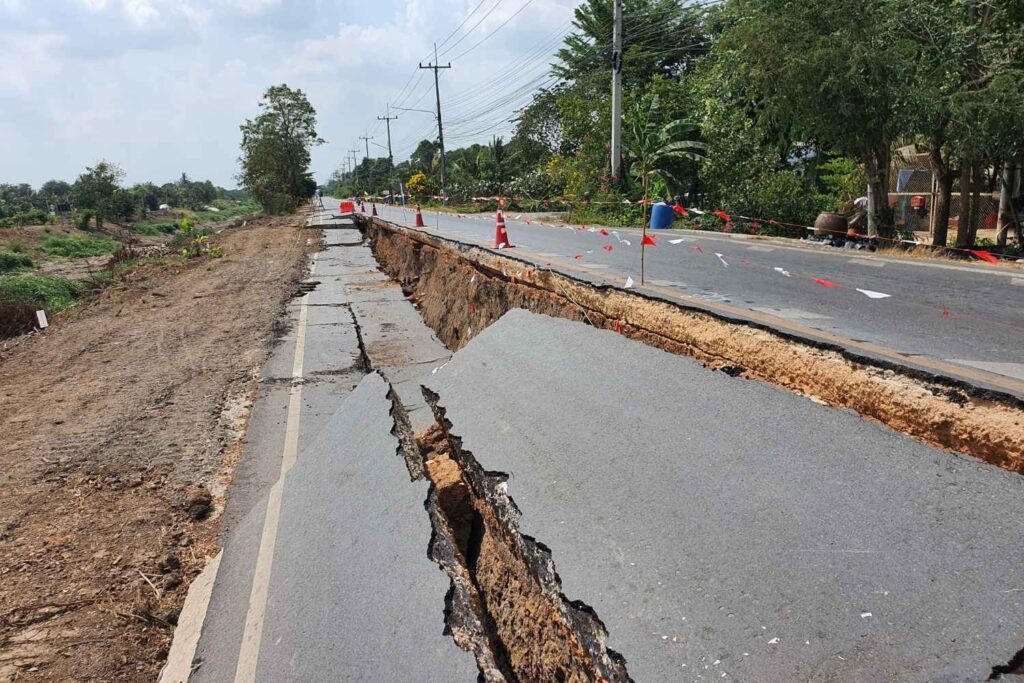
2. Flood exposed regions experience repeat system failures.

Infrastructure located near rivers, coasts, and floodplains faces repeated damage rather than one time disasters. Roads wash out, wastewater systems overflow, and pump stations fail under storms that now arrive more often and with greater intensity.
Federal disaster records show the same counties filing infrastructure related claims again and again over multiple decades, as reported by FEMA. Repairs restore function but rarely redesign vulnerability. Pipes are replaced in the same locations. Roads are rebuilt at the same elevations. Without structural change, water finds the same weaknesses every time, turning predictable exposure into chronic failure.
3. Rapid growth suburbs overload aging support systems.

Fast growing suburban counties often rely on infrastructure built for rural or low density use. Roads designed for farm traffic now carry commuter volumes. Sewer and water systems scaled for thousands must suddenly serve tens of thousands.
Government audits show infrastructure stress rising fastest in high growth counties where expansion outpaces long term investment, according to the U.S. Government Accountability Office. Development fees cover construction but not decades of maintenance. The gap grows quietly until systems reach capacity. Failure follows population curves so closely that breakdowns can often be forecast by building permit data alone.
4. Extreme heat regions face accelerating material breakdown.

Heat degrades infrastructure faster than many design standards anticipated. Asphalt softens, concrete expands, and metal components fatigue under prolonged high temperatures. Regions with longer heat seasons now experience failures once considered rare.
Transportation agencies report increased pavement buckling and joint failure in southern and western states. Electrical utilities see transformers pushed beyond thermal limits during sustained heat waves. These breakdowns cluster where average temperatures exceed historical norms for longer periods. The issue is not isolated heat events but cumulative stress on materials never engineered for constant exposure at these extremes.
5. Rural communities endure slow motion infrastructure collapse.
Rural infrastructure fails differently than urban systems. Problems accumulate quietly. Bridges lose load ratings. Roads degrade without resurfacing. Water systems operate past certification without upgrades.
Lower population density means fewer inspections and limited political visibility. When failures finally occur, emergency repairs cost more and disrupt daily life severely due to lack of alternatives. Data shows rural bridge closures rising steadily nationwide. The predictability lies in neglect patterns. Where oversight and funding remain thin, decay progresses uninterrupted until safety thresholds are crossed.
6. Low income neighborhoods carry the highest failure burden.
Infrastructure breakdowns disproportionately affect economically disadvantaged communities. Aging pipes, unreliable power lines, and unsafe roads persist longer where residents lack political leverage or advocacy resources.
Public health and utility data show higher exposure to boil water advisories, outages, and road hazards in lower income zip codes. Maintenance delays accumulate as repairs are prioritized elsewhere. These patterns repeat across states and cities. Failure is not accidental. It reflects decades of investment decisions that concentrate risk where resistance is weakest and visibility lowest.
7. Coastal infrastructure suffers from overlapping stressors.
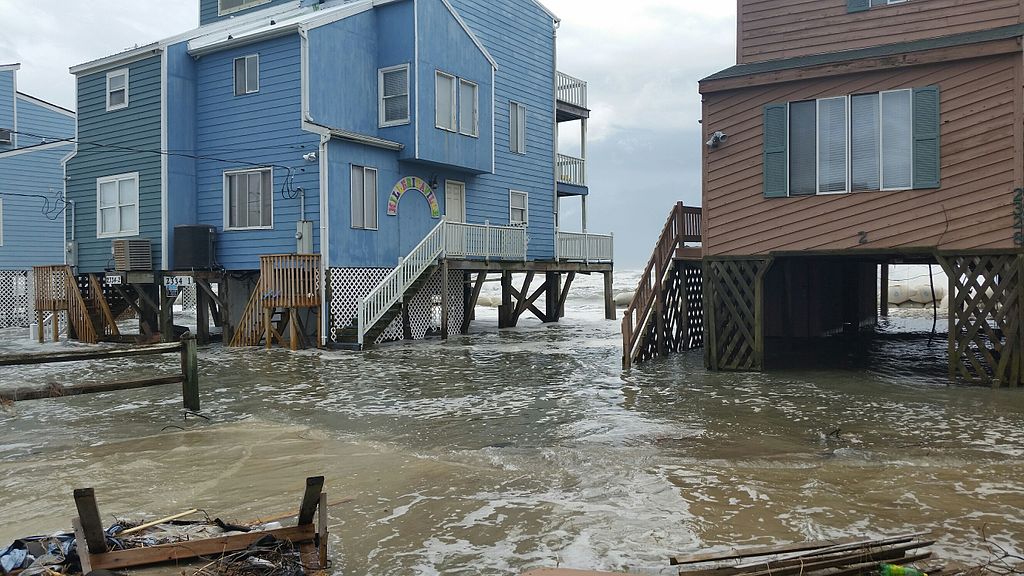
Coastal regions face simultaneous degradation from salt corrosion, rising water tables, stronger storms, and shifting sediment. Bridges corrode faster. Underground utilities flood more frequently. Ports and highways endure constant environmental assault.
Engineering inspections show accelerated wear on coastal structures compared to inland counterparts. Storm surge damages systems designed for lower baseline water levels. These forces interact rather than act independently. The result is compounded stress in predictable corridors where multiple degradation mechanisms converge year after year, overwhelming maintenance budgets.
8. Aging dams and levees show known warning signs.
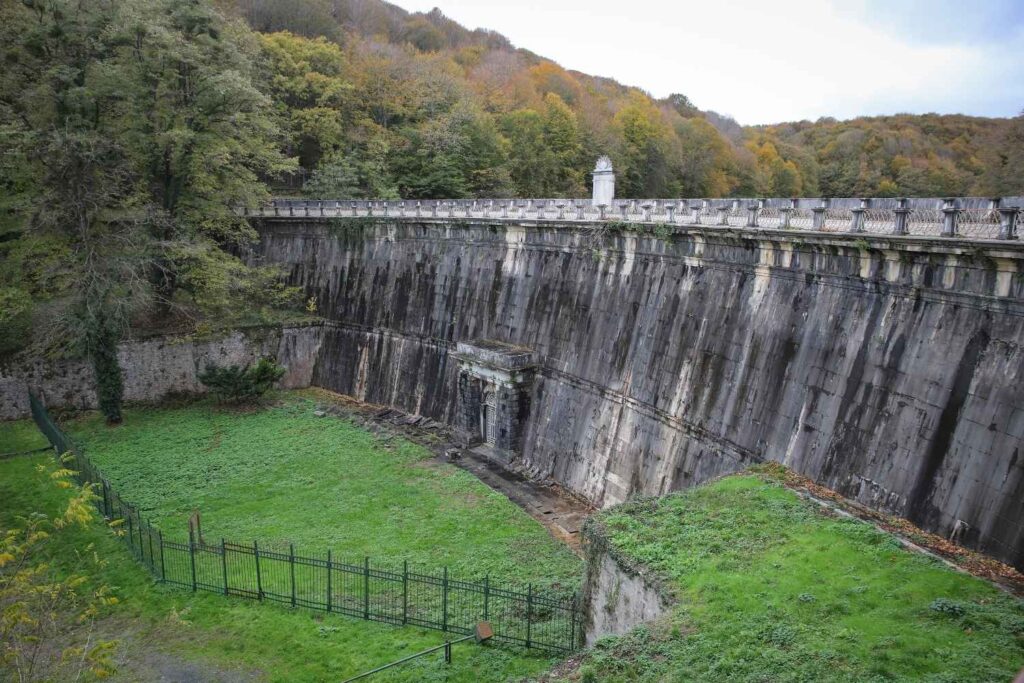
Thousands of dams and levees across the country exceed their original design life. Many protect downstream communities that expanded long after construction, increasing consequences of failure.
Inspection reports frequently flag seepage, erosion, and structural deficiencies that remain unresolved due to funding gaps or jurisdiction disputes. Small incidents often precede major breaches. Data shows warning indicators appear years in advance. Failure becomes likely not because signals were absent but because responses were delayed repeatedly until margins vanished.
9. Power grids fail where redundancy was never built.
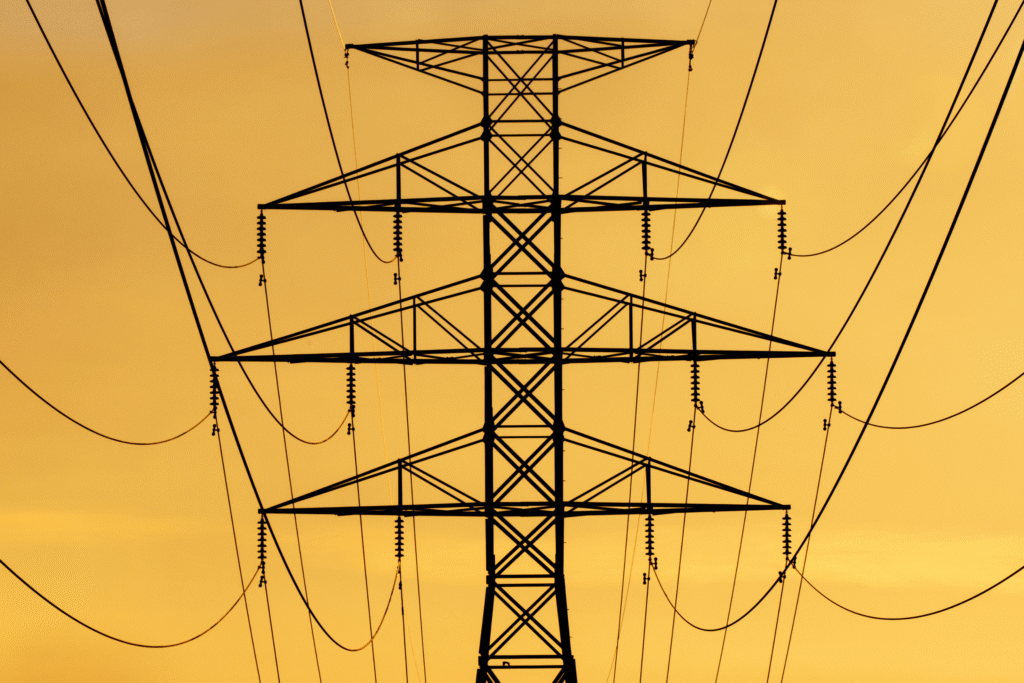
Grid resilience depends on redundancy. Regions designed with minimal backup capacity experience longer outages when failures occur. Single component breakdowns cascade quickly through interconnected systems.
Utilities built for stable weather now face heat waves, ice storms, and intense winds. Outage data shows recovery times increasing most where grids lack modern switching and storage. Predictability emerges from design history. Where redundancy was sacrificed for short term savings, modern stress exposes fragility with growing regularity.
10. Maintenance patterns predict failure better than infrastructure age.
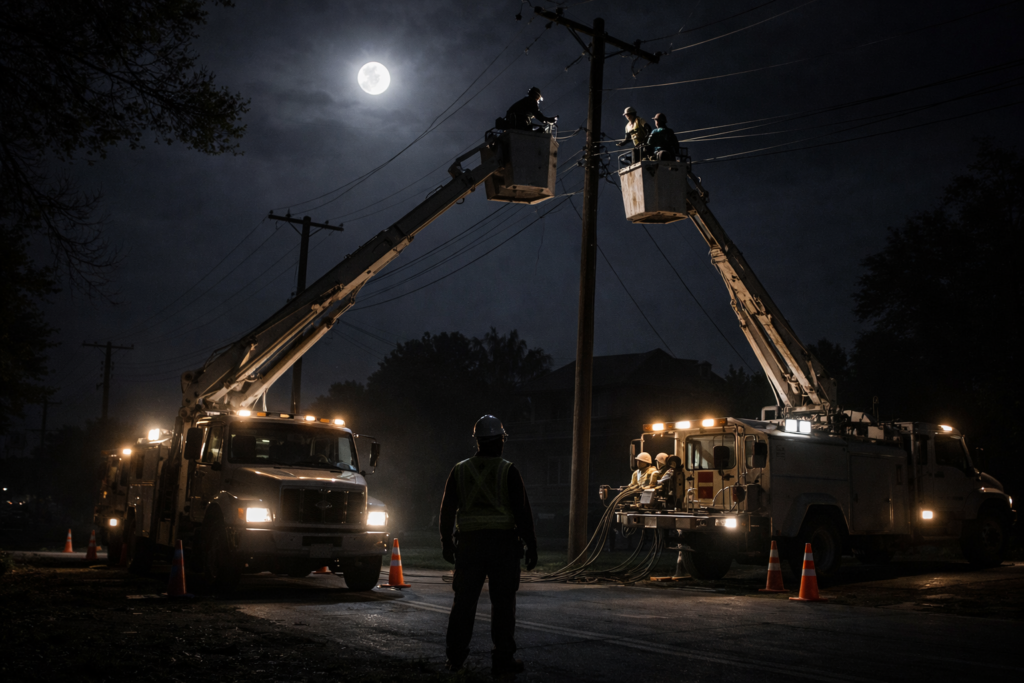
Age alone does not determine failure. New infrastructure fails when maintenance lapses, while older systems endure when upkeep is consistent. Data increasingly shows inspection frequency and repair timing matter more than construction date.
Regions with routine monitoring outperform newer systems neglected after installation. Small repairs prevent cascading damage. Missed inspections allow minor issues to multiply. The emerging lesson is not about replacing everything at once. Infrastructure collapses where maintenance culture erodes. Failure follows neglect with remarkable consistency, regardless of how modern a system once appeared.